venerdì 23 gennaio 2015

Simple blog analytics with keen.io

Nowadays most, if not all, blog platforms out there provide you with some kind on analytics data.

In my case I am using google's blogger and as expected the stats about my blogs are very good and detailed.
I also have other web sites which I normally track with google analytics. Google analytics is providing any possible info you can imagine about your pages. This is very good!!.

However for me such an amount of information is overwhelming.
In most of the cases I don't need all such details. I just care about number of visitors, sessions and nothing else.

Last but not least each the different platform provides his own dashboard.
I would like to have such information in my TrackMe dashboard (see my previous post Track your life with Tasker and Keen.io - Part 2)

Image Beacon

Once again keen.io provides me the necessary tool which is called Image Beacon

The concept is not really new and still very effective. The idea is to  embed a small (very small) transparent image in your HTML content and every time someone hit your page the transparent image is requested by the browser.

The URL of the image is pointing to keen.io service. When keen.io receives such particularly crafted URL will add an event to your selected collection and send back to the browser the transparent image.

This way you can easily track any content you have on your blog or any other type of web site.

Simple, quick and effective.!!!

Let's now see an example:

Let's assume your projectID is PROJECT_ID. Your write api key is API_KEY and your collection is COLLECTION

You construct the URL of the image in this way

https://api.keen.io/3.0/projects/PROJECT_ID/events/COLLECTION?api_key=API_KEY&data=BEACON_DATA

You are wondering what is BEACON_DATA?
Simple is the event you want to record in your collection when your page/post is hit.

An example of BEACON_DATA is:

{
  "post_id": 1234,
  "post_title": "my blog post",
  "hit": 1
}

However you cannot put this JSON in the above URL. keen.io requires that you value the data parameter with the base64 representation of the above JSON chunck.

In this case the base64 representation is:

ewogICJwb3N0X2lkIjogMTIzNCwKICAicG9zdF90aXRsZSI6ICJteSBibG9nIHBvc3QiLAogICJoaXQiOiAxCn0K


So now we have all the element to craft the final beacon image URL:

https://api.keen.io/3.0/projects/PROJECT_ID/events/COLLECTION?api_key=API_KEY&data=ewogICJwb3N0X2lkIjogMTIzNCwKICAicG9zdF90aXRsZSI6ICJteSBibG9nIHBvc3QiLAogICJoaXQiOiAxCn0K

It might look complex but it is not.

Now just add this image to your HTML content

<img src="https://api.keen.io/3.0/projects/PROJECT_ID/events/COLLECTION?api_key=API_KEY&data=ewogICJwb3N0X2lkIjogMTIzNCwKICAicG9zdF90aXRsZSI6ICJteSBibG9nIHBvc3QiLAogICJoaXQiOiAxCn0K"></img >

After that every time your page will be hit a new event will be added to your keen.io COLLECTION.

Auto Collection & Data Enrichment

I found very interesting and useful also the Data Enrichment and the Auto Collection

Using those two very useful features let's see another possible BEACON_DATA chunk:


{
    "keen" : {
        "addons" : [
            {
                "name" : "keen:ip_to_geo",
                "input" : {
                    "ip" : "ip_address"
                },
                "output" : "ip_geo_info"
            }
        ]
    },
    "ip_address" : "${keen.ip}",
    "user_agent" : "${keen.user_agent}",
    "hit": 1,
    "post_id": 1234,
    "post": "your post title"
}


As in the previous example let's calculate the base64 of this chunk:


ewogICAgImtlZW4iIDogewogICAgICAgICJhZGRvbnMiIDogWwogICAgICAgICAgICB7CiAgICAgICAgICAgICAgICAibmFtZSIgOiAia2VlbjppcF90b19nZW8iLAogICAgICAgICAgICAgICAgImlucHV0IiA6IHsKICAgICAgICAgICAgICAgICAgICAiaXAiIDogImlwX2FkZHJlc3MiCiAgICAgICAgICAgICAgICB9LAogICAgICAgICAgICAgICAgIm91dHB1dCIgOiAiaXBfZ2VvX2luZm8iCiAgICAgICAgICAgIH0KICAgICAgICBdCiAgICB9LAogICAgImlwX2FkZHJlc3MiIDogIiR7a2Vlbi5pcH0iLAogICAgInVzZXJfYWdlbnQiIDogIiR7a2Vlbi51c2VyX2FnZW50fSIsCiAgICAiaGl0IjogMSwKICAgICJwb3N0X2lkIjogMTIzNCwKICAgICJwb3N0IjogInlvdXIgcG9zdCB0aXRsZSIKfQo=

and again this is the final image tag to add to yours HTML content

<img src="https://api.keen.io/3.0/projects/PROJECT_ID/events/COLLECTION?api_key=API_KEY&data=ewogICAgImtlZW4iIDogewogICAgICAgICJhZGRvbnMiIDogWwogICAgICAgICAgICB7CiAgICAgICAgICAgICAgICAibmFtZSIgOiAia2VlbjppcF90b19nZW8iLAogICAgICAgICAgICAgICAgImlucHV0IiA6IHsKICAgICAgICAgICAgICAgICAgICAiaXAiIDogImlwX2FkZHJlc3MiCiAgICAgICAgICAgICAgICB9LAogICAgICAgICAgICAgICAgIm91dHB1dCIgOiAiaXBfZ2VvX2luZm8iCiAgICAgICAgICAgIH0KICAgICAgICBdCiAgICB9LAogICAgImlwX2FkZHJlc3MiIDogIiR7a2Vlbi5pcH0iLAogICAgInVzZXJfYWdlbnQiIDogIiR7a2Vlbi51c2VyX2FnZW50fSIsCiAgICAiaGl0IjogMSwKICAgICJwb3N0X2lkIjogMTIzNCwKICAgICJwb3N0IjogInlvdXIgcG9zdCB0aXRsZSIKfQo="></img >

This is an example of an event which is created using this URL


{
    "hit": 1,
    "keen": {
        "timestamp": "2015-01-23T19:57:58.922Z",
        "created_at": "2015-01-23T19:57:58.922Z",
        "id": "54c2c7c6a6662c1527843321"
    },
    "user_agent": "Mozilla/5.0 (Windows NT 6.1; WOW64) AppleWebKit/537.36 (KHTML, like Gecko) Chrome/40.0.2214.91 Safari/537.36",
    "post_id": 1234,
    "post": "your post title"
    "ip_geo_info": {
        "province": "Turin",
        "city": "San Benigno Canavese",
        "postal_code": null,
        "continent": "Europe",
        "country": "Italy"
    },
    "ip_address": "A.B.C.D"
}    


pretty cool,eh? :) I love it!!! :)


Image beacon simple tool

As the people who knows me knows that I am lazy, I have created a real simple bash script which is creating the IMG tag for me. 

You can find it on git hub.


The repository contains to files:
  • data_beacon.json
  • keen_beacon.sh

Use it in this way:
  • edit your data_beacon.json as you like
  • edit (only first time) keen_beacon.sh and insert your PROJECT_ID, API_KEY and COLLECTION
  • execute ./keen_beacon.sh

This will generate an output similar to this (it depends on content of data_beacon.json):


https://api.keen.io/3.0/projects/PUT YOUR PROJECT ID HERE/events/PUT YOUR COLLECTION HERE?api_key=PUT YOUR API KET HERE&data=ewogICAgImtlZW4iIDogewogICAgICAgICJhZGRvbnMiIDogWwogICAgICAgICAgICB7CiAgICAgICAgICAgICAgICAibmFtZSIgOiAia2VlbjppcF90b19nZW8iLAogICAgICAgICAgICAgICAgImlucHV0IiA6IHsKICAgICAgICAgICAgICAgICAgICAiaXAiIDogImlwX2FkZHJlc3MiCiAgICAgICAgICAgICAgICB9LAogICAgICAgICAgICAgICAgIm91dHB1dCIgOiAiaXBfZ2VvX2luZm8iCiAgICAgICAgICAgIH0KICAgICAgICBdCiAgICB9LAogICAgImlwX2FkZHJlc3MiIDogIiR7a2Vlbi5pcH0iLAogICAgInVzZXJfYWdlbnQiIDogIiR7a2Vlbi51c2VyX2FnZW50fSIsCiAgICAiaGl0IjogMSwKICAgICJwb3N0X2lkIjogMTIzNCwKICAgICJwb3N0IjogInlvdXIgcG9zdCB0aXRsZSIKfQo=


<img src="https://api.keen.io/3.0/projects/PUT YOUR PROJECT ID HERE/events/PUT YOUR COLLECTION HERE?api_key=PUT YOUR API KET HERE&data=ewogICAgImtlZW4iIDogewogICAgICAgICJhZGRvbnMiIDogWwogICAgICAgICAgICB7CiAgICAgICAgICAgICAgICAibmFtZSIgOiAia2VlbjppcF90b19nZW8iLAogICAgICAgICAgICAgICAgImlucHV0IiA6IHsKICAgICAgICAgICAgICAgICAgICAiaXAiIDogImlwX2FkZHJlc3MiCiAgICAgICAgICAgICAgICB9LAogICAgICAgICAgICAgICAgIm91dHB1dCIgOiAiaXBfZ2VvX2luZm8iCiAgICAgICAgICAgIH0KICAgICAgICBdCiAgICB9LAogICAgImlwX2FkZHJlc3MiIDogIiR7a2Vlbi5pcH0iLAogICAgInVzZXJfYWdlbnQiIDogIiR7a2Vlbi51c2VyX2FnZW50fSIsCiAgICAiaGl0IjogMSwKICAgICJwb3N0X2lkIjogMTIzNCwKICAgICJwb3N0IjogInlvdXIgcG9zdCB0aXRsZSIKfQo="> < /img >

That's really all about it.

Hope this is useful. Let me know if you have ideas to improve it.

take care!!!

Track your life with Tasker and Keen.io - Part 2

This post is the second part of my previous post (Track your life with Tasker and Keen.io - Part 1) on using keen.io for personal life event tracking

In part 1 I have quickly explained how I use keen.io simple REST API to track and store events in the keen.io's cloud.
I have also created an Android application using Tasker and I made everything available on git hub for everyone to use and contribute.

In this post I am now focusing in visualizing the information collected and stored in the cloud.
 I should admit that once again, keen.io is doing most of the job for me. Yet another reason for me to considering it a great service.


Datahero.com

One very simple way to visualize keen.io events information is to use another cool service from the team at https://datahero.com/

On their website is written that Datahero "Create rich analyses and share your insights in seconds."

I used for something like 15 minutes and I can only agree with that statement.

I have created a trial account and in matter of minutes I was proficient in visualizing my analytical data from keen.io

You just need to:
  • connect keen.io to datahero
  • import your preferred keen.io colletion
  • create some charts using a cool visual editor
  • add your chart to a dashboard

There are way too many option for me to explain in this post but from what I have seen it is a very interesting service.

Below the simple dahsboard I have created by connecting keen.io and datahero. It took me no more that 12 minutes!!! :)


Keen.io dashboards

Al alternative way (there are many more ways) for lazy :) people like me is to use the great tools provided by keen.io at this link https://github.com/keen/dashboards 

Even if you are not a developer you can easily build your own personalized dashboard in minutes with the tools provided.

Start by cloning the git with the following command (on Linux. On Windows can be different)

git clone https://github.com/keen/dashboards.git

This will provide you with plenty of dahsboard layouts ready to use


and some interesting example to learn from (what else one can ask for? :) )


I am here using the two and one layout which I like it


you can find it in the following directory <YOUR DIRECTORY>/dashboards/layouts/two-and-one assuming that YOUR DIRECTORY is where you have executed the git clone command

Have a look at index.html. This is the file to modify to populate your dashboard with beautiful charts


The structure is very simple. Every chart area of the layout is a set of 3 self-explanatory DIV

Set the proper title for your chart (<div class="chart-title">) and add a relevant note (<div class="chart-notes">)

In order to add the chart you need to modify the <div class="chart-stage"> in the following way:

  • delete the <img data-src="holder.js/100%x350/white"> line. This is just a placeholder
  • add an id to the chart-stage div like this:  <div class="chart-stage" id="chart1">

The id will be useful later and will be used by the keen.io data visualization API 

keen.io query designer

Now we have our layout ready to display our chart which is taking the data out of the keen.io collection.
What is missing is a small chunk of Javascript which build the proper query and instruct the kee.io client to display the chart.

Don't worry this is unbelievable easy: just go to https://keen.io/project/<YOUR PROJECT ID>/workbench

You will access your keen.io Workbench. This is a very easy to use tool to generate the necessary JS code for your dashboard


Select the mandatory collection you want to query and the analysis type (sum, average, ....).
In addition you might specify optional parameters like filters, timeframe, ....
You can read all the detail about Data Analysis API here 

When you have properly set up your query just hit the Run Query button and you will be immediately see a chart representing your query.


In order to see the Javascript code which generates the chart click on the Javascript tab. You should see something similar to this


That's it!! :)
Just cut&past this chunk of JS into your index.html, wrap it into a <script></script> block  and you will see the chart appearing in your own dashboard.


You should replace the projectId and the readKey with your values that you can find in your keen.io project page.

Also very important is to change this line client.draw(query, document.getElementById("my_chart") in client.draw(query, document.getElementById("chart1")

This line is telling keen.io visualization client to run the query called query and to display the resulting chart in the div with id chart1

Save your file and refresh your web browser and bam!!! Your own dashboard is up and running

Here a simple one I have created out of the data collected with my Track Me application


These layouts are fully responsive and display perfectly also on my android phone


The charts are fully customizable and have many options to set.
You can find detailed information here Google Charts

In this two part series of post I have shown you how it is easy to collect, store, analyze and visualize your valuable information.  The trick is to use smart and easy to use tools like keen.io and others.

If you like this idea let me know. If you don't like it let me know
Feel free to contribute.

Happy analytics!!! :)

sabato 17 gennaio 2015

Track your life with Tasker and Keen.io - Part 1

When I was a kid I was used to count everything around me. Actually I am still having such habit. :)

Everywhere I go I count objects around me. No particular reason for it, just that I get bored very quickly and counting keep me busy with something to do. :)

I always been interested in numbers, statistics and analytics. Over the time I have also developed some simple web app helping me to track important parameters for me.

Recently I have stumbled upon a fantastic service called keen.io  and I have decided to build a simple app to keep track of my life events and parameters.

In this post I'll explain you what I have done and I'll share the app with you so you can take it and improve it in case you find it useful.


Tools

The tools I have used for my tracking application are:
  • keen.io: a very good data collection and analytics service in the cloud
  • Tasker: the best app for Android which I have ever purchased

Keen.io

Keen.io allows me to send event data to the cloud via a well designed REST API. Store such data in the cloud and create beautiful analytics dashboards . They have a free of charge plan for up to 50.000 event/month, clear and well written documentation, SDK for the major languages (JS, Ruby, Python, iOS, Android, Java, .Net and even Scala).
In short they provides everything I always been looking for to implement a simple and extensible tracking application.

For additional information I suggest you to look into the documentation 

Tasker

Tasker is defined as "Total Automation for Android" by its author.
This is totally true and I would add that Tasker is the factotum for Android. Whatever you have in mind can be more or less easily achieved with tasker and its plug-ins.

With Tasker App Factory you can even build native Android application that you can even distribute through the Play store.

For additional information I suggest you to look into the user guide

TrackMe app

Nowadays you can find in the market many cool devices and apps that helps you to track different aspects of your life. There are tons of fitness bracelets, activity trackers, sleep trackers, whatever trackers. 
However those cool devices are all independent form each other. They all provide a separate app and analytic tool.
The only "smart" device which is always with you from morning to end of the day is your phone.
So why not using it as one single tracker device? 
With your smart phone you can track your fitness activities, your sleep etc...

This is exactly what TrackMe app is doing.


Tasks and Scenes

Using Tasker tasks and scenes I have created a simple and easily extendable app to track whatever parameter is relevant for me.

The scenes are basic input dialog which collects a specific activity or parameters (i.e. my weight, the number of Km of my car, fuel consumption, etc...)

The tasks are basic set of instruction and command to execute. The basic action shows the scene, collect the value entered by the user (me) and send the value to keen.io to be stored in a specific collection.

So far I have created the following scenes:


  • trackme_dlg_gas: scene to acquire gas or electricity counter number


  • trackme_dlg_denti: scene to acquire information whether my daughter has washed her teeth or not


  • trackme_dlg_dieta: scene to acquire the daily point of a diet program I am following


  • trackme_dlg_peso: scene to acquire my weight 


  • trackme_dlg_rifornimento: scene to acquire the information about my car when I refill the tank


  • trackme:  the main app scene


So far I have created the following tasks:
  • TRACKME_PESO
  • TRACKME_GAS
  • TRACKME_ELETTRICITA
  • TRACKME_DENTI
  • TRACKME_DIETA
  • TRACKME_RIFORNIMENTO
  • TRACKME: the main task 

All the above tasks are executed when the relative icon in the main scene is tapped with the finger.

  • TRACKME_KEEN_CONFIG: contains the keen.io configuration 
  • TRACKME_KEEN_SENDER: sends through HTTP POST the event data information to cloud keen.io
The two above tasks do not have any scene associated. They are just used to interact with keen.io service.


Some of the above task and scenes are configured through the use of Tasker's variable.
This is to allow anyone to easily change important parameters.

As an example the title of each scene is not hard-coded but is defined in a variable. So you can change it without modify/editing the scene.

Keen.io Configuration

In order to use this tasker app you first need to configure a couple of simple kee.io parameters.
You can find such information in your keen.io's account page.

What you need is your keen.io:

  • Project ID
  • API Key

Now you can open the TRACKME_KEEN_CONFIG task and set the following variables:


  • %TRACKME_KEEN_PROJECT_ID: in the To field insert your keen.io Project ID
  • %TRACKME_KEEN_API_KEY: in the To field insert your keen.io API Key

That's it!! At this stage your Track Me app is ready to use.

Other Configurations

Each task which is associated with an image icon in the Track Me app has few variables can be customized according to your own preferences.

Let's analyze those variables:

  • %TRACKME_DIAG_TITLE:  change the content of this variable to personalize the Title of the UI dialog associated to the task
  • %TRACKME_KEEN_COLLECTION:  change this variable to personalize the name of the keen.io's collection you want to store the data in
  • %TRACKME_KEEN_EVENT:  change the content of this variable to personalize the data structure of your data event you want to store on keen.io cloud
Next to those variables there are other text string that can be changed in order to display your preferred text messages. (i.e. all my messages are in Italian, but you can change it with English text)


Extending Track Me app

I provide a template scene called trackme_dlg_template.

In order to create a new tracker follow the below steps:

  • duplicate the template scene
  • customize the template scene as you prefer
  • make sure your new scene properly set a variable called %TRACKME_DLG_VAL.  This is the data field which will go into the %TRACKME_KEEN_EVENT variable (I have used variables to pass data from scenes back to the task and to keen.io cloud)
The %TRACKME_DLG_VAL variable should be set according to the below:
  1. NaN in case you want to abort the operation (i.e. pressing the Cancel button)
  2. Value in case you want to send an event data to keen.io

  • create or duplicate an existing task
  • properly configure the newly created task
  • edit the main trackme scene
  • add a new image to main scene (select your preferred icon)
  • associate such an image to the newly created task (see above)
  • edit the text below the icon image in the main scene
That's it. You can extend Track Me app with as many tracker as you want in few minutes.


Icons

In my Track Me app I have used a mix of built-in icon and icons from the Glossy Silver HD icon pack (freely available in Play Store)

Obviously this is my choice but nothing is preventing you to use a complete different icon set.

Code

All the tasker scenes and tasks are available on my git hub 

Download it, use it, change it, improve it, do whatever your like and let me know your result. I can only learn from you!!! 

NOTE: I provide on github the userbackup.xml file. This way you can very easily import the full Track Me application in your Tasker. Please note however that this will completely overwrite and existing profiles, tasks and scenes. So always make sure you make a proper backup of your Tasker objects. 

Use

Let's now see a quick example on the usage of Track Me app

  • run the trackme task: I do it by tapping on a icon on my home screen on Android phone (you can add it through tasker widget


  • Click one of the icons (Peso = Weight in this example)
  • The proper UI dialog is now shown

  • Enter the weight though keyboard
  • Press the Send (INVIA) button
  • Now the dialog close and you will see again the main app
  • A couple of confirmation message will be shown
Sending Data


Weight correctly registered

At this stage your weight has been correctly sent and accepted by keen.io. It is now stored in your trackme_peso collection and it is available for further use (analytics).


If you regularly (daily or weekly) send your weight to keen.io you can easily answer to questions like those:
  • what was my minimum weight in the last 6 months
  • what was my maximum weight in the last 6 months
  • what was my average weight in the last 6 months
  • how many time I have gone above the 75 Kg in the last 6 months
  • ...
  • ...

Let's see now that the weight just sent to keen.io is properly stored.
Go to your keen.io account and select the project you have configured in %TRACKME_KEEN_PROJECT_ID

You should see something like that


Now click on Last 10 Events


As you can see there are 5 different events (weight) in my collection.

The #1 is the last sent. Click on it and you show see something like that


Now we can see that the weight (80 Kg) we have inserted has been properly stored by keen.io


Contribute

If you are interested in this concept feel free to contribute.
You can do it in many ways:
  • spot errors
  • make suggestion to improve the existing app.
  • create new scenes and task
  • suggest new trackers
  • improve the graphical design
  • ...

Conclusion

The combination of such incredible tools like Tasker and keen.io allows me to quickly and easily keep track of the important aspect of my life.
It has never been easier than now to create useful application for our daily life. We should take advantage of that.

I hope the sharing of my work here will create some discussion. I am curious to read about new tracker and new aspect of our busy life to track and analyze.

In part 2 I will quickly show how to visualize and analyze the data collected and stored on keen.io.

Cheers!!


martedì 23 dicembre 2014

Arduino e motore DC con H-bridge L293D

Nel precedente post http://mancusoa74.blogspot.it/2014/12/arduino-e-motore-dc.html ho spiegato con pilotare un motore DC con Arduino.

Tuttavia in quel post il motore poteva girare in un solo verso siccome ho usato un ULN2003.


In questo post uso un L293D, cioe' un chip che implementa due circuiti Half-Bridge (per maggiori info: http://www.rakeshmondal.info/L293D-Motor-Driver


In questo modo e' possibile controllare il verso di rotazione del motore.

Circuito


Ho implementato il circuito riportato qui sopra


Sketch

Ho implemetato questo semplicissimop sketch che fa ruotare il motore in un versoper  1 secondo e poi nel verso opposto per 1 secondo

void setup() {
  Serial.begin(9600);
  Serial.println("Staring");

  pinMode(2, OUTPUT);
  pinMode(7, OUTPUT);
}


void loop() {

  digitalWrite(2, HIGH);
  digitalWrite(7, LOW);
  delay(1000);          

  digitalWrite(2, LOW);
  digitalWrite(7, LOW);
  delay(2000);
  
  digitalWrite(2, LOW);
  digitalWrite(7, HIGH);
  delay(1000);

  digitalWrite(2, LOW);
  digitalWrite(7, LOW);
  delay(2000);  
}


Come si vede dal codice il motore e' controllato dai pin 2 e 7:


  • Se i pin sono entrambi HIGH o LOW il motore e' fermo.
  • Se il pin 2 e' HIGH e il 7 e' LOW il motore gira in senso orario
  • Se il pin 2 e' LOWe il 7 e' HIGH il motore gira in senso antiorario


Verifica Funzionamento

Come sempre verifichiamo che il tutto funzioni come previsto


mercoledì 10 dicembre 2014

Arduino e motore DC

In questo post spiego brevemente come pilotare un motore in corrente continua con Arduino.


Il controllo e' molto piu' semplice rispetto ad un motore passo-passo (Arduino e Motore Passo Passo)

Nel caso del motore DC non ci sono fasi da alimentare in sequenza.
Basta applicare una tensione ai morsetti ed il motore gira. Se si inverte la tensione il motore gira in senso contrario.

Questa minor complessita' nel far ruotare il motore rispetto ad un passo-passo ha pero' lo svantaggio che con un motore DC non si ottiene una rotazione precisa e controllata come con il passo-passo.

Mentre nel motore passo-passo si puo' far ruotare il motore di un numero di step o gradi ben determinato con un motore DC si possono solo specificare la tensione da applicare e la durata dell'impulso di alimentazione.

Quindi normalmente i motori DC e passo-passo vengono utilizzati in applicazioni diverse.


Come nel caso del motore passo-passo, Arduino non puo' alimentare il motore direttamente. Si rischia seriamente di bruciare la scheda Arduino.

Anche in questo caso ci vuole un driver per il motore.
Normalmente si usa un transistor di potenza in configurazione Darlington, per esempio TIP 120.

Siccome io non ho un TIP 120 o simile o pensato di utilizzare il ULN2003  che e' un chip che racchiude 7 transistor Darlington.

Quindi funzionalmente il ULN2003 equivale a 7 TIP 120, percio' perfetto per qusto uso


Il ULN2003 l'ho riciclato dalla scheda di controllo per motore passo-passo che ho usato in un mio precedente post


In aggiunta al ULN2003 ho anche usato un piccolo condensatore applicato ai poli del motore a spazzole in corrente continua.


Anche in questo caso ho utilizzato un semplice 7805 per ricavare i 5V necessari a questo circuito partendo da una batteria a 9V. (Nel post relativo ai motori passo-passo spiego meglio come realizzarlo).


A questo punto ho tutti gli elementi necessari a realizzare il semplice circuito.


Ecco come ho cablato il tutto su una breadboard.


Adesso che il circuito e' pronto vediamo il software.


Sketch di controllo

Ho creato un semplice sketch per Arduino (basato sullo sketch usato per il post relativo al controllo bluetooth)


#include <string.h>

//struttura del comando
struct CMD {
  int  speed;  //speed of the motor
  int  time; //timeof the impulse
};

int i = 0;
int readByte = 0;
char buff[255]; //contiene i dati ricevuti
struct CMD parsed_cmd; //comando ricevuto

void setup()
{
  Serial.begin(9600); 
  bt_println("Init!!!!");
}

//pulisce il buffer dopo che e' stato utilizzato
void clear_buff()
{
  for (i=0; i < 255; i++)
    buff[i] = 0;
}

//println verso bluetooth
void bt_println(String str)
{
  Serial.println(str);
  delay(10);
}

//print verso bluetooth
void bt_print(String str)
{
  Serial.print(str);
  delay(10);
}

//parsing della stringa ricevuta in un comando da eseguire
//comando ha il seguente formato:  PIN--COMANDO. esempio: 13--OFF; 13--ON
struct CMD read_command(char *command)
{
  struct CMD cmd;
  const char s[3] = "--";
  char *token;
 
  token = strtok(command, s);
  cmd.speed = atoi(token);
  
  token = strtok(NULL, s);
  cmd.time = atoi(token);  

  return cmd;
}

int validate_cmd(struct CMD cmd)
{
  return ((cmd.speed > 0) && (cmd.speed < 256) && (cmd.time > 0));
}

void execute_cmd(struct CMD cmd)
{
  int speed = cmd.speed;
  int time = cmd.time;
  
  analogWrite(3, speed);
  delay(time);
  analogWrite(3, 0);
}

void loop()
{
  clear_buff();  
  delay(100);
  
  if ((readByte = Serial.available()) > 0) {
    bt_println("-------------------------");
    
    Serial.readBytes(buff, readByte);
    
    bt_println(String("Parsing commnand: ") + buff);
        
    parsed_cmd = read_command(buff);
    
    if (validate_cmd(parsed_cmd)) {   
      bt_println(String("SPEED = ") + String(parsed_cmd.speed));
      bt_println(String("TIME = ") + String(parsed_cmd.time));
      execute_cmd(parsed_cmd);
    }
    else
      bt_println("ERROR: COMMAND NOT VALID!");
  }
}


Per utilizzare lo sketch basta inserire un semplice comando nel monitor seriale seguendo questo formato:

V--T

dove


  • V = velocita' di rotazione (1 -- 255)
  • T =  durata dell'inpuslo in millisecondi

Quindi per esempio il comando 128--500 fara' ruotare il motore a meta' della sua velocita' massima per 500 ms.
Allo stesso modo 255-1000 lo fara' ruotare alla massima velocita' per 1 secondo


Verifica Funzionamento

Come sempre verifichiamo che il tutto funzioni come previsto


lunedì 8 dicembre 2014

Arduino e Motore Passo Passo

In questo post spiego brevemente come pilotare un motore passo-passo con Arduino.

Ci sono vari modi per pilotare un motore passo-passo. Nel mio caso ho un motore 28BYJ-48


e una scheda di controllo ULN2003


In questo modo e' facilissimo pilotare il motore passo-passo.

Come si vede la scheda di controllo richiede:
  • +5V
  • GND
  • 4 GPIO di Arduino (per controllare i 4 avvoglimenti del motore in questione)
E' imporante notare che l'alimentazione della scheda e quindi del motore non deve essere prelevata da Arduino, altrimenti quasi certamente lo friggiamo.

L'alimentazione deve essere esterna ad Arduino


Nel mio caso siccome ho una batteria a 9V ho creato un semplice regolatore DC-DC di tensione in modo da ottenere i 5V richiesti per l'alimentazione del motore.

Regolatore DC-DC

Lo schema del circuito di un semplice regolatore DC-DC e' semplicissimo


Come si vede dalla figura ho usato un 7805 e due condensatori. Nel mio caso il condensatore Ci all'ingresso ha una capacita' di 100 uF e Co all'uscita una capacita' di 10 uF.

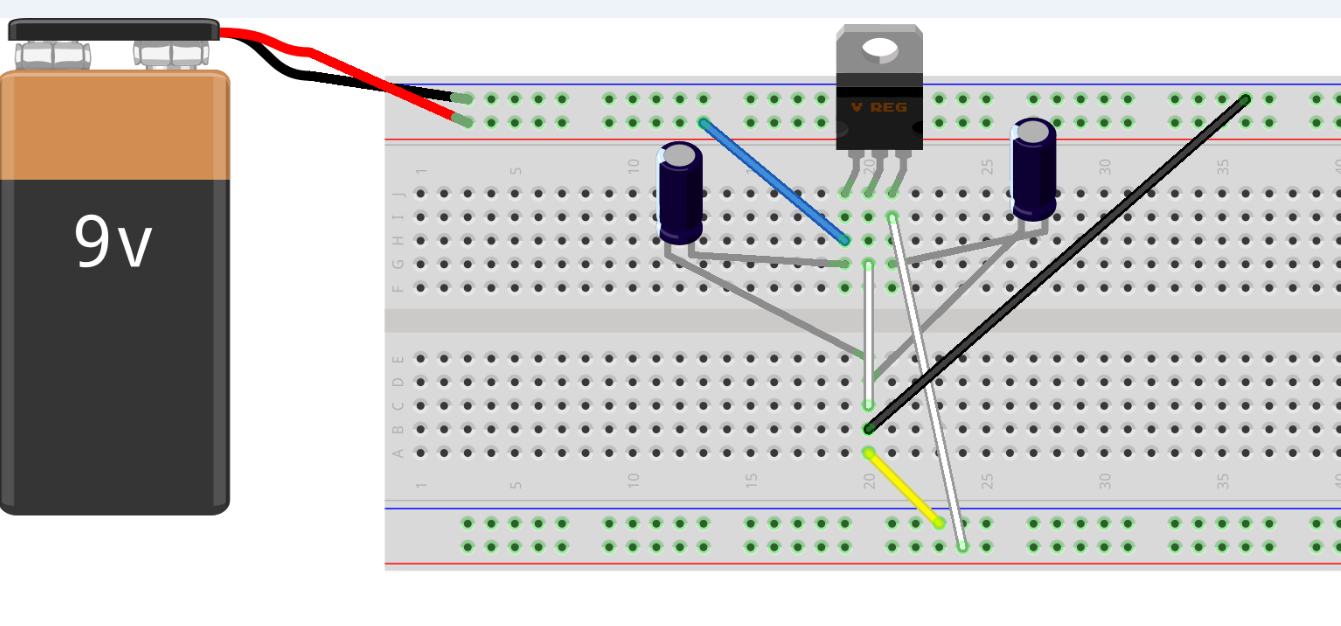
Qui sotto un semplice schema di come ho montato il regolatore su una breadboard:


Ecco come ho realizzato velocemente il regolatore sulla basetta:


Ok a questo punto sulle due piste in basso (filo giallo e bianco) ho i +5V e GND con cui alimentero' il motore passo passo e la scheda di controllo.


Collegamento motore ad Arduino

Adesso ho collegato il motore alla scheda di controllo e questa ad Arduino come spiegato qui sotto.


Il motore ha un connettore con 5 fili. Lo collego alla scheda (entra in una sola direzione).


Dopo di cio' ho inserito i fili dell'alimentazione in questo modo:


  • filo rosso -> GND
  • filo marrone -> +5V

Adesso collego questi due fili alla breadboard all'uscita del regolatore DC-DC


Il filo rosso in corrispondenza del filo giallo sulla breadboard (GND)
Il filo marrone in corrispondenza del filo bianco sulla breadboard (+5V)


A questo punto ho collegato la scheda di controllo del motore ad Arduino come spiegato qui sotto.


  • filo nero         --> pin IN1 della scheda motore
  • filo marrone   --> pin IN2 della scheda motore
  • filo rosso        --> pin IN3 della scheda motore
  • filo arancione --> pin IN4 della scheda motore


Dal lato Arduino:

  • filo nero         --> pin 8
  • filo rosso        --> pin 9
  • filo marrone   --> pin 10
  • filo arancione --> pin 11

Nota
Come notate i pin 9 e 10 sono invertiti per far si che il motore possa giare in senso orario e antiorario.
Immagino che queso sia un problema della schedina da 2$.
Quindi tutto sommato solo invertendo i fili abbiamo risolto il problema.

A questo punto ho collegato la batteria alla breadboard rispettando la polarita'.


Arduino Sketch

Ho creato questo semplice sketch (basato su stepper_oneRevolution) che rimane in attesa di input dal monitor seriale di arduino


#include <Stepper.h>

const int stepsPerRevolution = 4;  

int readByte = 0;
char buff[255]; //contiene i dati ricevuti
int steps = 0;

// initialize the stepper library on pins 8 through 11:
Stepper myStepper(stepsPerRevolution, 8,9,10,11);            

void setup() {
  // set the speed
  myStepper.setSpeed(4096);
  // initialize the serial port:
  Serial.begin(9600);
}

void clear_buff()
{
  int i = 0;
  for (i=0; i < 255; i++)
    buff[i] = 0;
}

void loop() {
  clear_buff();  
  delay(100);
  
  if ((readByte = Serial.available()) > 0) {
    // insert the number of step (+ or -) manually trhough serial monitor  
    Serial.readBytes(buff, readByte);
    steps = atoi(buff);  
    Serial.println(steps);
    myStepper.step(steps);
  }
}


Inserisci il numero di step e il verso in cui si vuole che il motore giri:
  • 2048 : il motore compie un giro completo in senso orario
  • -2048: il motore compie un giro completo in senso antiorario
  • 1024: il motore compie mezzo giro in senso orario

Dopo varie prove ho verificato che i valori 4 per stepsPerRevolution e 4096 per la velocita' di rotazione sono i migliori. In questo modo il motore compie un giro completo in circa 6 secondi.

Potete variare questi due valori ma fate in modo che il prodotto dei due valori sia sempre 16384.

Verifica Funzionamento

Come sempre verifichiamo che il tutto funzione come previsto!!!


Come sempre chiunque abbia idee e migliorie e' il benvenuto.